Hardware Health Monitor - Is your PC overheating? Is a drive about to fail? How worn is the battery? (Updated Nov 2026)
Description
Most hardware problems give a warning before they cause real trouble. A PC that runs too hot slows itself down (that's often the "lag" you notice), and many drives start reporting damaged areas weeks or months before they fail. Windows collects these warnings but doesn't show them anywhere a normal person would look.
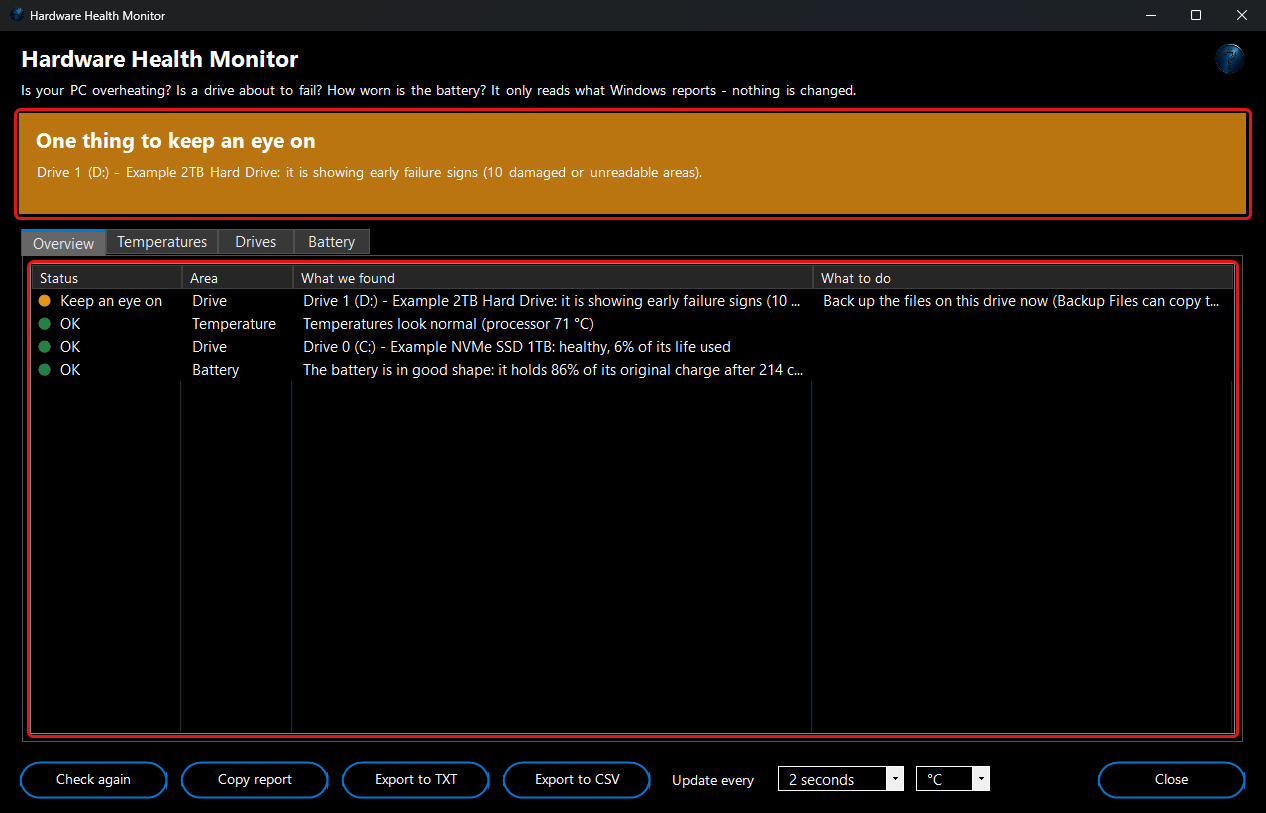
Hardware Health Monitor puts them in one window. A coloured banner at the top gives the answer in plain English, such as
Your PC's hardware looks healthy,
One thing to keep an eye on or
Back up now: a drive is showing failure signs, with what to do about it. Underneath are the full details: every temperature sensor your PC reports, with a 30-minute graph; each drive's own health data; and the battery's wear and charge cycles.
The tool is
read-only and installs nothing. It doesn't change any setting and doesn't add a hardware driver. It shows what Windows itself can read, so what you see depends on what your PC maker reports (see
Good to know below).
How to use
1. Open
Hardware Health Monitor (in
System Information & Optimization, or type "temperature", "drive health" or "battery" in the search box). It starts reading straight away; the first reading takes a few seconds.
2. Read the coloured banner.
Green means everything looks fine.
Amber means something to keep an eye on.
Red means act now, for example back up your files.
3. The
Overview tab lists everything it found, each marked
OK,
Keep an eye on,
Act now or
Note, with a
What to do column. Hover over a row to read all of it.
4. The
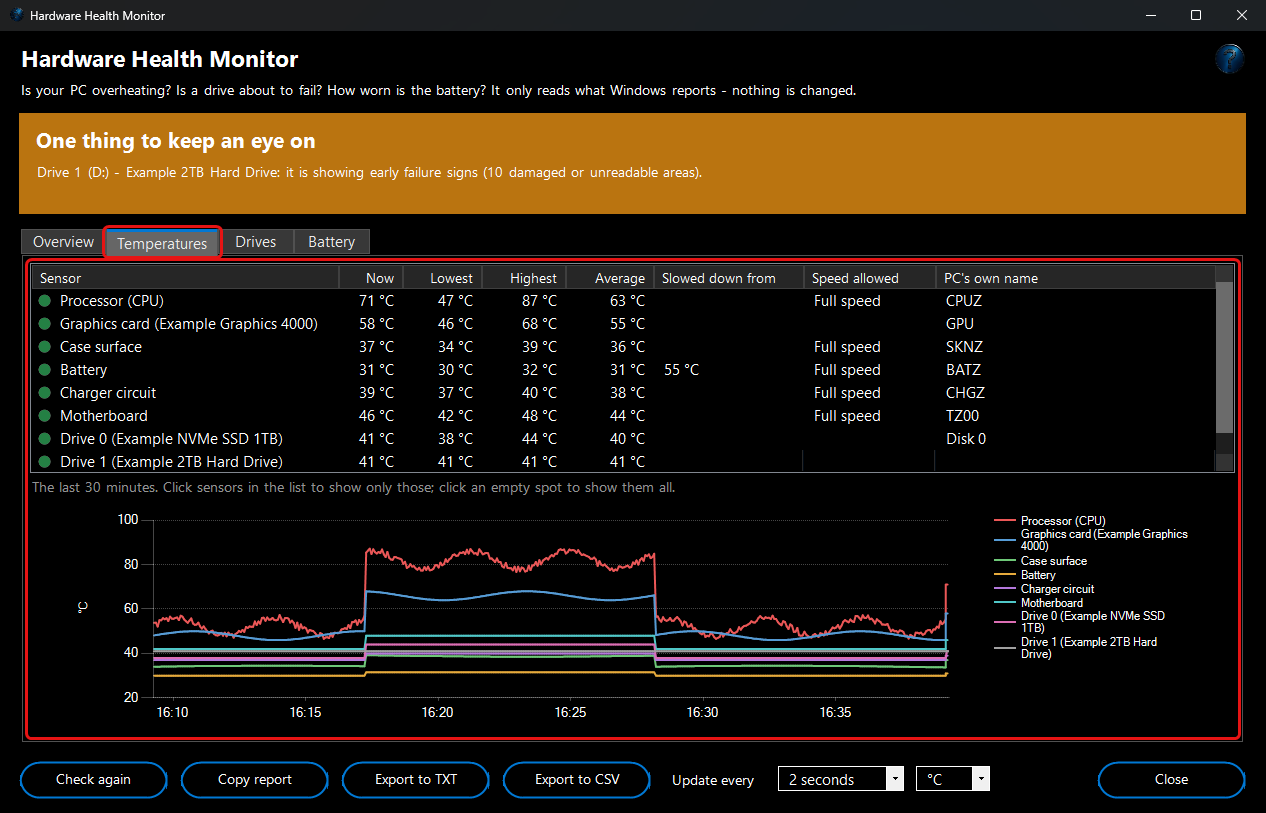
Temperatures tab lists each sensor with its temperature now and the lowest, highest and average since you opened the window.
Slowed down from is the temperature at which Windows starts slowing that part down to cool it.
Speed allowed says
Full speed or, when it's being held back, how much. The graph below shows the last 30 minutes. Click a sensor in the list to show only its line, or click an empty spot to show them all again.
5. The
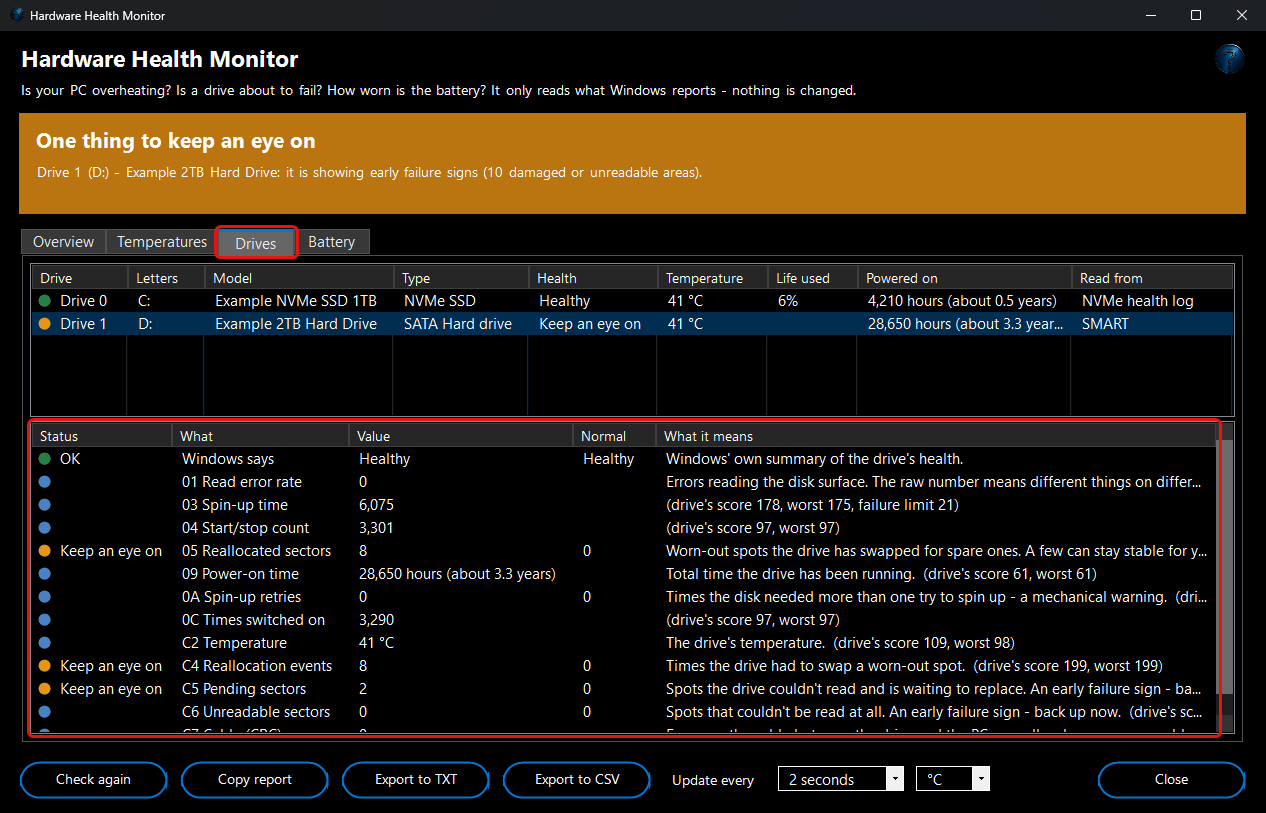
Drives tab lists every drive. Click one to see its health details below: how much of its rated life is used, spare space, data it couldn't read, damaged areas, temperature, power-on time and more. Each row says what's normal and what it means.
6. The
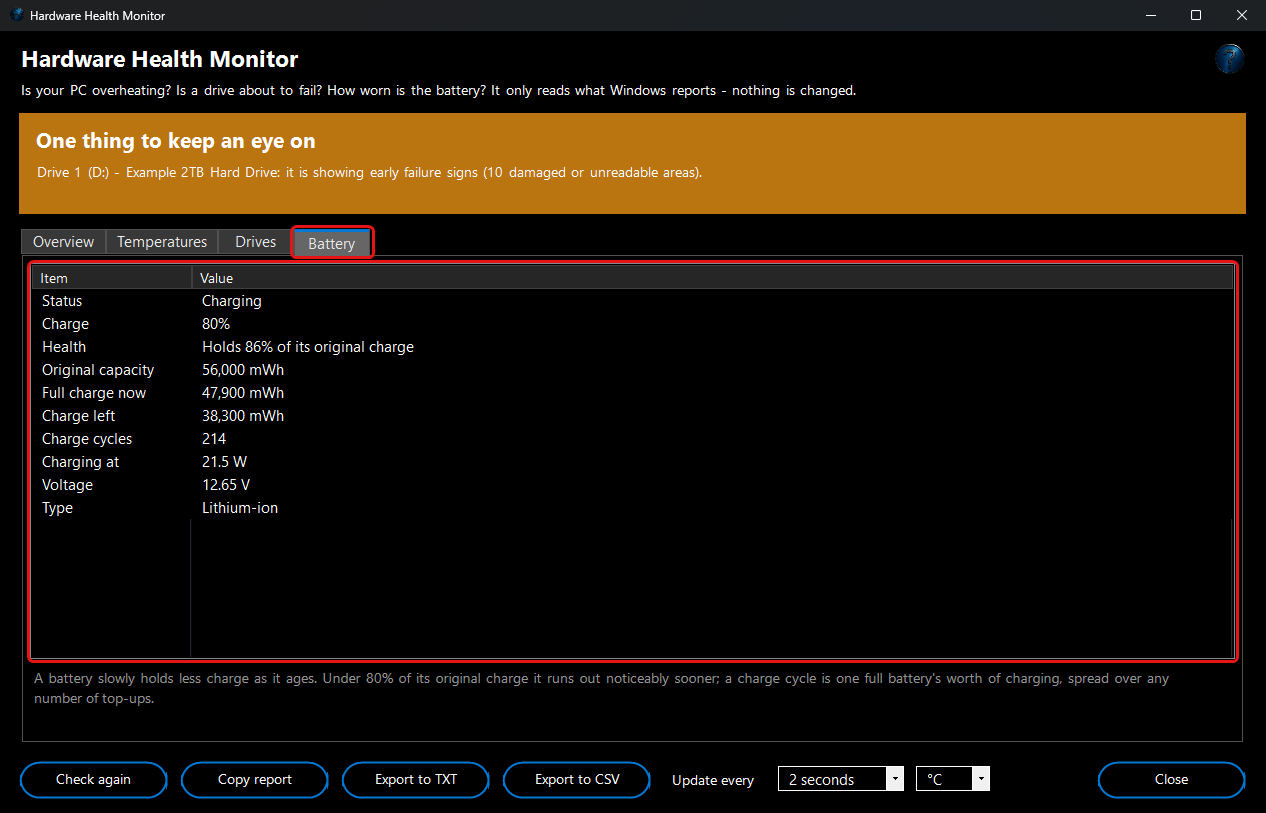
Battery tab (laptops) shows how much of its original charge the battery still holds, its charge cycles, the charge now and how fast it's charging or being used.
7. Leave the window open while the PC works hard (a game, a video call, a big export) to watch the temperatures. Use
Update every to choose how often they're read (2, 5, 10 or 30 seconds) and the °C / °F box to change the units.
8. Check again re-reads the drives and the battery.
Copy report and
Export to TXT save everything as text;
Export to CSV saves the list on the tab you're looking at (on the
Drives tab, every value of every drive) for a spreadsheet.
Example: a laptop that lags during video calls
Sam's laptop gets sluggish about ten minutes into every video call. Sam opens Hardware Health Monitor before the next call and leaves it open. Fifteen minutes in, the banner turns amber:
Windows is slowing the PC down to cool it (Processor (CPU)). The
Temperatures tab shows the processor at 96 °C with
Speed allowed at 62% (slowed down), and the graph shows it climbing steadily from the start of the call. The laptop was sitting on a sofa cushion, which blocked its air vents. On a desk, with the dust blown out of the vents, it stays under 85 °C and at full speed.
Example: an older drive with early failure signs
Jordan's PC has a 4-year-old 2 TB hard drive used for photos (drive D:). The banner says
One thing to keep an eye on:
Drive 1 (D:) - it is showing early failure signs (10 damaged or unreadable areas). On the
Drives tab,
Reallocated sectors shows 8 and
Pending sectors 2, both marked
Keep an eye on. Jordan copies the photos to another drive with
Backup Files straight away. A week later the numbers have gone up, so the banner turns red:
Back up now: a drive is showing failure signs and
it is getting worse. Because the photos are already safe, Jordan simply replaces the drive.
How it works and what to expect
- Temperatures come from the sensors your PC maker reports to Windows (called "thermal zones"), plus the graphics card's own temperature where Windows shows it in Task Manager, plus each drive's own temperature. Their names come from the PC (for example CPUZ, shown in the PC's own name column). The tool translates the common ones (processor, graphics, battery, case surface, charger) and keeps the rest as Sensor ....
- When it warns about heat: short bursts of heat while the PC works hard are normal, so a warm reading only becomes Keep an eye on when it stays there for 5 minutes. For example, the processor at 90 °C or more for 5 minutes, the graphics card at 87 °C or more, the case surface at 48 °C or more, or a battery at 45 °C or more. Act now is for readings that are hotter still, or that pass the point where Windows starts slowing the part down. If Windows is already slowing the PC down to cool it, you're told straight away.
- Drives: for NVMe SSDs it reads the drive's own health log (life used, spare space, data it couldn't read, time spent too hot, sudden power losses, total data written). For SATA drives it reads their SMART data (the drive's self-monitoring values, such as damaged areas it has swapped out). For every drive it also shows Windows' own summary. Drives are read when the window opens, every 5 minutes after that, and when you click Check again.
- "Getting worse": each time the window opens, it notes each drive's damaged-area and error counts (just the numbers, not the drive's serial number) in the app's own data folder. If a later check finds more, it tells you the drive is getting worse. That's the strongest warning sign there is.
- Battery: health is the full charge now compared with the charge it was made to hold. 80% or more is good; under 80% it runs out noticeably sooner; under 60% it's badly worn. A charge cycle is one full battery's worth of charging, spread over any number of top-ups.
- It only watches while the window is open. The graph and the lowest / highest / average values start again each time you open it.
- Your choices (how often it updates, °C or °F, the tab you were on, the size of the list and graph, and any column widths you drag) are remembered for next time.
Good to know
- No fan speeds or per-core temperatures. Reading those needs a special hardware driver, and this tool deliberately doesn't install one. You'll see a fan speed only where the graphics card reports it. Many PCs report a processor temperature to Windows, but some (often desktops) report none. The tool then says so plainly, and still tells you whether Windows is slowing the processor down.
- Administrator rights: FW Admin Tech Tools Pro always runs as administrator and sees everything. Without administrator rights, the Slowed down from temperatures and the SMART data of SATA drives can't be read.
- USB drives usually don't pass their health data through USB. The tool shows Windows' summary for them and says so.
- No tool can promise a drive won't fail without warning. Keep backups of anything you can't lose, whatever the banner says.
Troubleshooting
- "This PC doesn't report its processor temperature to Windows": your PC maker doesn't share it. The other sensors, the drives and the battery are still checked, and so is whether Windows is slowing the processor down.
- The Temperatures list is empty: the PC reports no temperatures to Windows at all. That's common on desktop PCs. The drive temperatures still appear once the drives have been read.
- A drive says "Run the app as administrator to read this drive's own health data": open the app as administrator (right-click it and choose Run as administrator), or use FW Admin Tech Tools Pro.
- The battery's health looks low on a new laptop: some batteries report a slightly optimistic original capacity, so check it again after a few full charges. If the battery only reports percentages, the tool tells you its wear can't be worked out.
- A temperature looks stuck: some PCs report a sensor that never changes (often around 28 °C). Watch the graph for a few minutes; a real sensor moves when the PC is busy.